martes, agosto 08, 2017

Sobre el entrenamiento en bioinformática en Colombia y América Latina

En varios países de América Latina, y particularmente en Colombia, todavía nos falta dar grandes pasos en bioinformática, para aparecer en el mapa mundial del área. Recientemente EMBL-EBI junto con algunos "socios" en América Latina lanzaron el proyecto CABANA, que da pasos adecuados para mejorar el entrenamiento en Bioinformática en la región. Algunos investigadores españoles no están de acuerdo con la motivación de CABANA (en mi opinión, algo errado. Necesitamos mas esfuerzos como CABANA). El Dr. Marco Cristancho, Ex-Director del Centro Colombiano de Bioinformática y Biología Computacional, escribió una respuesta a los comentarios del grupo español, y me permitió compartirla, aquí la dejo para ustedes.
I carefully read the so-called ´criticism´ of the recent launched program CABANA, addressed to improve Bioinformatics and ´omics´ sciences in Latin-American (LA), and I have some comments about the statements on the writing: The people commenting on the project, who wrote a review paper about Bioinformatics developments in the region, are based in Spain not LA, we wonder if they contacted anybody from LA countries to write together that review to have a first-hand view of developments in LA. In their review, they come to the not surprisingly conclusion that this field of research “should still develop twice to approach the average world scientific production in the field” showing the slow implementation of Bioinformatics that wants to address CABANA. I disagree with that statement, Bioinformatics and Genomics have to grow to a 4 or 5 times current rate to have any particular meaning in LA science developments, as I will manifest in the next paragraphs.
Authors mentioned that SolBio is a strong organization composed of 400+ scientists in the region (19 countries). That number is probably close to the number of scientists working on Bioinformatics in NYC, Boston, California (any city), or any major city in Europe. That is a case to say that Bioinformatics is far from going strong in LA. Authors do not mentioned a single world-recognized group from LA that leads the field. There are several countries in the region where developments in Genomics and Bioinformatics is close to zero, just check Universities curriculums and programs in research centres to realize that.
Several SolBio members were contacted to be part of this initiative. In fact, there are members of the society that lead the program in their countries. For a project like this, the effort to include everybody in such a vast region with so many countries is immense. However, we tried to contact leading scientists from these fields in every country in LA. We had to exclude scientists from Chile and Uruguay, because they are out of the ODA list of low and middle-income countries, a requirement to be included in the proposal. We sent mails to 50+ leading scientists in LA countries. As usually happens with we Latin people, most of those mails were unanswered. Several colleagues who answered did not have the time to participate in the initiative even when we needed very little information from them at the time of writing the proposal, we needed just their willing to participate.
Just to give you another example of the little importance of research in these areas in LA; as the article mentioned, the project was conceived for the first time in Colombia, however, at the time of this writing no Institute from the country has come forward to be the leader of the initiative and there has not been major interest in the project in several leading Institutes where the project has been presented. Another example, Colombia launched a Bioinformatics research centre BIOS, to our knowledge unique in the region given the fact that it is an independent Institute not linked to any University or major Research Centre. BIOS has been financed by the government and after about three years of functioning is been dismantled for bioinformatics research with no great concern from the scientific community.
Most of those doing Bioinformatics and Genomics in LA are involved in small projects. Several countries in the region are rich in biodiversity; but you just have to check any database with molecular data to realize that the number of species having any data at all is very small. Only Colombia harbours around 30.000 plant species in its territory, no more than 2.000 of those are represented in the databases and the scenario is the same for the rest of the countries. What is worst? Over 60% of that data have been collected by groups based in the US, Japan or Europe with no involvement whatsoever from LA scientists. Only México and Brazil have got involved in projects for the sequencing of a few plants and animals of their biodiversity. To my knowledge, there are no major projects in the region to mass sequence species from any biological group (humans included) as it is happening in other regions of the world.
I understand and agree that molecular and other sensitive data has to be treated with caution and any biodiversity study in our countries has to be conducted in a sustainable and responsible way. But there is a great deal of ignorance of that biodiversity and I don´t think that having it “untouched” and “undiscovered” is a proper way of protecting it. If we in LA collect molecular data from our species we will decisively have a strong defence in future scenarios to protect those species that can be used for industrial purposes. Otherwise we face the current picture where we take very little advantage of that biodiversity and instead some companies in other countries still use it for their commercial developments.
It is true that the project seems to be of a small scope but as we mentioned we did not get answer from many people to participate in the proposal and research in the region is concentrated in only few countries, Brazil, México, Chile, and Argentina. We have the current aim of including additional research groups in our proposal, which should start on October 1st. We know about the DEANN project, a similar initiative led by Spain and other European countries (http://bioinfo.cipf.es/deann/?page_id=18), with the aim of developing a NGS network in the region. That project only includes those 4 countries and I wonder if scientists from other LA countries were invited.
Unfortunately LA is not well recognized by science investments, efforts and developments. It is hard to do research in a region where bureaucracy, corruption and politicians short-sighted view of science does not allow for a proper environment for scientific endeavours. I do strongly think that DEANN, CABANA and other efforts to strengthen Bioinformatics, Genomics and other scientific areas in Latin America are urgently needed. Those initiatives were borne with the purpose of improving science in the region and trying to conduct scientific collaborations between LA countries, something that is extremely rare but very much needed.
Marco-Aurelio Cristancho, PhD Bioinformatics Advocate for Latin America

martes, junio 07, 2011

Visit to Poland: Roche 454 GS Junior Data

I was visiting my friend Miroslaw Kwasniewski an Assistant Professor at the University of Silesia in Katowice, Poland. He is got a GS Junior 454 machine which I wanted to check out. Besides that, he wanted some help with their bioinformatics servers and pipelines.


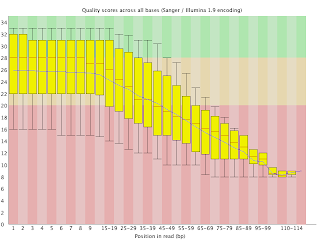
I was just looking at one dataset, transcriptomics from barley, obtained from the GS Junior, and read counts, read lengths and quality are all great, very impressive. I have some statistics obtained using FastQC, after exporting the SFF file from GS Junior to FastQ format using sff_extract.

This is the distribution of the read quality on a per base basis. As you can see, reads can be well over 400, around 500bp with Phred qualities above 20.


The sequence length distribution has a nice peak around 500 bp.


GS Junior could achieve 100.000 reads throughput, Mirek was getting 150.000 reads.

GS Junior seem to be quite good for sequencing low complexity samples. Quality and length of the sequencing reads is great, but depth for a e.g., full transcriptome in angiosperms, would be either challenging or too expensive. It is great for amplicon sequencing, bacterial genome sequencing, virus genome sequencing, i.e., would be great for the phages (!).

viernes, junio 03, 2011

Secuenciación del genoma de cepa de E. coli que está causando problemas en Alemania

En mayo de 2011 un brote de diarrea hemorragica se desató en los estados de la región norte de Alemania. Varios de los casos reportados causaban sindrome urémico hemolítico, caracterizado por insuficiencia renal y transtornos neurológicos. Investigadores alemanes identificaron que el agente responsable de brote es una nueva variante de la bacteria Escherichia coli entero-hemorrágica (EHEC, por sus siglas en inglés) serotipo O104.

El Instituto de Genómica de Beijing (BGI) acaba de liberar las secuencias crudas obtenidas usando Ion Torrent de la cepa de E. coli que está causando el brote de EHEC en Alemania.

El BGI liberó las lecturas crudas correspondientes a 5 corridas del Personal Genome Machine (PGM) de Ion Torrent, los datos están disponibles en el NCBI SRA con el número de acceso: SRA037315. Los datos se pueden descargar en formato .sra. El SRA tiene un kit de software que permite convertir el formato sra en fastq o sff. Yo los exporte en formato fastq, usando el comando:

for i in $(ls *.sra); do name=`basename $i .sra`; fastq-dump -TR -W -F -SL -A $name $i; done

La opción tal vez mas importante en este comando es -W que remueve los extremos de baja calidad de las lecturas.

Uno de los primeros paso antes de continuar al ensamble de las lecturas es revisarla un poco, e.g., longitud, calidades. Este tipo de análisis se puede adelantar con FastQC.

Corrida (SRA accession)Número de LecturasRango de tamaños
SRR227300923701-119
SRR2273371222081-129
SRR227338967651-125
SRR2273392222751-131
SRR227340957501-129

La calidad es buena hasta la posición ~40, a partir de allí cae drasticamente. No muy sorprendente para este tipo de tecnologías. Las gráficas con similares para las otras 4 corridas. La siguiente figura corresponde a la distribución de calidad en todas las corridas (archivos fastq concatenados).

Sobre la longitud de las secuencias, la Figura de abajo, muestra que el PGM genera lecturas en un rango bastante estrecho, con un pico en 100bp.


Como podemos observar los datos generados por el PGM de Ion Torrent son lecturas de ADN de longitud corta. En general este tipo de datos se prestan muy bien para hacer ensambles de mapeo, pero no muy bien para ensambles de novo. A pesar de estoy yo estoy interesado en ver las posibilidades y las limitaciones de este tipo de datos para los ensambles de novo. Mas adelante les contaré los resultados de estos experimentos.

jueves, mayo 05, 2011

El genoma de Selaginella nos permite encontrar cambios en el contenido genético asociados con la evolución de las plantas vasculares

Acaba de salir publicado el artículo que describe el genoma de Selaginella moellendorfii. Tuve la oportunidad de participar en ese estudio y creo que es buena idea re-activar este espacio con un resumen corto.

Selaginella es una planta terreste y que cuenta con un sistema vascular verdadero.

Foto: Selaginella moellendorffii (Jing-Ke Weng, Salk University)

Las plantas que colonizaron el ambiente terrestre empezaron a divergir hace mas de 450 millones de años. Los principales linajes que existen actualmente, resultado de esa divergencia, son los musgos, los licófitos y las plantas con hojas verdaderas (helechos y plantas con semillas). Selaginella es un licófito.

Desde el año 2000 conocemos los genomas completos de varias angiospermas (plantas con flores), e.g., Arabidopsis thaliana (prima de la mostaza), Oryza sativa (arroz). Desde el 2008 conocemos el genoma completo del musgo Physcomitrella patens, lo que nos permitió proponer algunos rasgos moleculares importantes en la colonización del ambiente terrestre. Pero para conocer las características moleculares que llevaron al desarrollo de vasos de transporte reales de nutrientes en las plantas era necesario conocer el genoma de un licófito, como la Selaginella moellendorfii. El estudio de este organismo nos permitió inferir, a partir de la comparación con otras plantas, que el desarrollo del sistema vascular requirió de la evolución de 516 genes nuevos, y que el desarrolló de las semillas se vio facilitado por la innovación representada en 1350 genes más.

En el desarrollo de esta investigación participaron mas de 100 investigadores de 11 países alrededor del mundo. Este estudio fue liderado por la Dra. Jo Ann Banks de la Universidad de Purdue en Estados Unidos de América. La participación de Joint Genome Institute adscrito al Departamento de Energía de Estados Unidos de América, aseguró el éxito del trabajo.

En Colombia las especies del genero Selaginella se conocen como doradilla y se emplean principalmente como plantas ornamentales. En Colombia, se encuentra principalmente en los departamentos de Amazonas, Caquetá, Cuaca, Guainía, Guaviare, Meta, Nariño, Vaupés y Vichada.

jueves, julio 15, 2010

Sobre las bolas de pelos: ridiculogramas

Quien no ha visto una imagen de una red? de internet, de reguladores de transcripción o de interacción entre proteínas?


Imagen tomada de http://www.bordalierinstitute.com/images/yeastProteinInteractionNetwork.jpg

Hoy en día son muy comunes y llaman mucho la atención. De hecho, uno de mis intereses particulares es estudiar la topología de esas redes y ver como responden a las perturbaciones.

Sin embargo la típica representación visual como bolitas y palitos no es muy útil, por eso ahora se les llama en forma generalizada 'bolas de pelos', incluso M. E. J. Newman, un experto en análisis de redes, las llama 'ridiculogramas'.

Un ridiculograma tiene las siguientes características:

* visualmente deslumbrantes.
* Sin valor científico.
* Publicados en Science o Nature.

lunes, julio 12, 2010

Ola de calor . . . y los servidores!

Este verano (2010) en el nor-este de Alemania hemos tenido temperaturas llegado a los 40°C, algo muy poco usual y que por supuesto ha estado estresando mas de la cuenta a los sistemas de refrigeración de nuestros cuartos de servidores.

Esta situación me llevo a instalar y configurar el paquete lm_sensors en mis servidores con CentOS. En principio todo era cuestión de instalar el paquete, detectar los sensores disponibles en el hardware (sensors-detect), cargar alguno módulos en memoria y revisar la temperatura con el comando
'sensors'. claro, la vida no es fácil, y el modulo coretemp que se necesitaba no esta instalado en CentOs, a pesar de que es incluido por defecto en versiones del kernel >= 2.6.22, pero la versión mas actual de CentOs 5.4 es 2.6.18. Ya me veía compilando el kernel y el modulo faltante.

Afortunadamente antes de enfrentar tan emocionante tarea hice una búsqueda que me ayudó a encontrar este sitio, en donde precisamente cuentan como instalar el modulo coretemp en centos 5.4.

En resumen:

1.- Descargar el rpm del modulo para el sistema deseado, en mi caso fue e15
2.- Instalar el modulo rpm -ivh kmod-coretemp-1.1-2.el5.x86_64.rpm
3.- ejecutrar (como root) sensors-detect
4.- ejecutar sensors, para ver las lecturas actuales de temperatura.

A este punto los sensores deben estar funcionando, claro con algo de suerte.

Para facilitar un poco el monitoreo escribí (partiendo de otro script que encontré en la web, pero cuya ubicación no recuerdo .-() un pequeño script de Perl que ejecuta 'sensors', guarda los datos en una base rrd, y crea las gráficas correspondientes al comportamiento de la temperatura. El script se puede ejecutar via cron, colectando datos cada 5 minutos.

Aquí esta el script:

#!/usr/bin/perl

use strict;
use warnings;
use RRDs;

# rrdtool databases
my $rrd = '/path/to/rrd/database/';
# output location of images
my $img = '/path/to/rrd/output/graphics/';

&CoreTemp();

sub CoreTemp{
my %cores;
my @CoreTemp=`sensors |grep Core`;
foreach my $line(@CoreTemp){
chomp $line;
if($line=~/^Core\s+(\d+):\s+([+-]\d+)°C/){
$cores{$1}=$2;
}
}
foreach my $core(keys %cores){
#if rrdtool database doesn't exist, create it
my $rrd_db="tempcore".$core.".rrd";
if(! -e "$rrd/$rrd_db"){
print "Creating RDD DB $rrd_db in $rrd . . . \n";
RRDs::create "$rrd/$rrd_db",
"-s 300",
"DS:temp:GAUGE:600:0:100",
"RRA:AVERAGE:0.5:1:576",
"RRA:AVERAGE:0.5:6:672",
"RRA:AVERAGE:0.5:24:732",
"RRA:AVERAGE:0.5:144:1460";
}
# insert value into rrd
RRDs::update "$rrd/$rrd_db",
"-t", "temp",
"N:$cores{$core}";
CreateGraph($core, "day");
CreateGraph($core, "week");
CreateGraph($core, "month");
CreateGraph($core, "year");
}
}

sub CreateGraph{
my ($core,$interval)=@_;
print "$core,$interval\n";
my $rrd_db="tempcore".$core.".rrd";
my $img_file="core".$core."-".$interval.".png";
RRDs::graph "$img/$img_file",
"--lazy",
"-s -1$interval",
"-t core temperature :: Core $core ",
"-h", "80", "-w", "600",
"-a", "PNG",
"-v degrees C",
"DEF:temp=$rrd/$rrd_db:temp:AVERAGE",
"LINE2:temp#0000FF:$core (Core $core)",
"GPRINT:temp:MIN: Min\\: %2.lf",
"GPRINT:temp:MAX: Max\\: %2.lf",
"GPRINT:temp:AVERAGE: Avg\\: %4.1lf",
"GPRINT:temp:LAST: Current\\: %2.lf degrees C\\n";
if (RRDs::error) { print "$0: unable to generate Core $core graph: $RRDs::error\n"; }
}


martes, junio 22, 2010

The foundation of scientific integrity - Richard P. Feynman

“The first principle is that you must not fool yourself—and you are the easiest person to fool.... After you’ve not fooled yourself, it’s easy not to fool other scientists. You just have to be honest in a conventional way after that.”

via: Scientific American